
A graph can look complicated at first glance, but sometimes one simple visual trick can tell you exactly what you need to know. The vertical line test is one of those tools. It helps you quickly determine whether a graph represents a function.
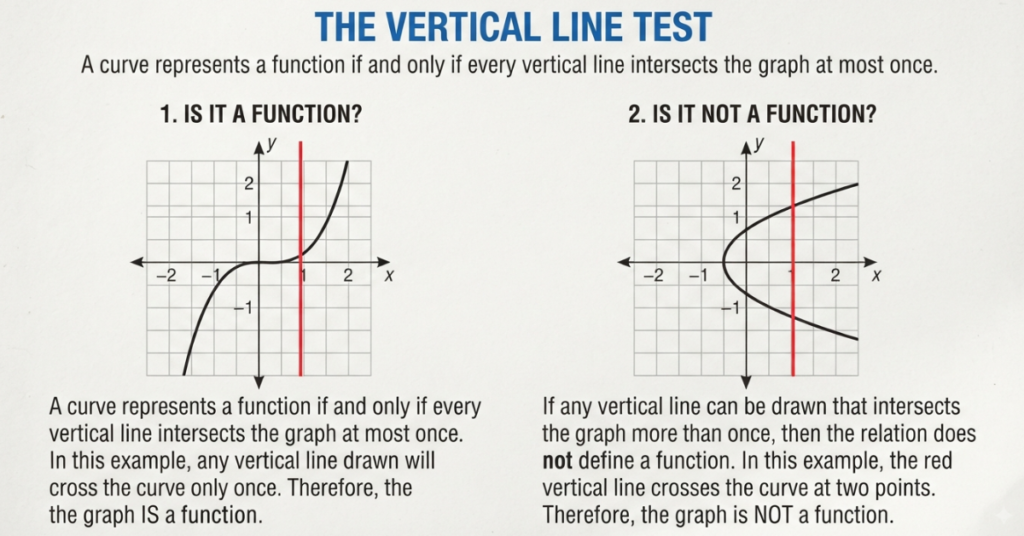
If you’re asked to explain what the vertical line test is and how it is used, the basic idea is straightforward: imagine drawing vertical lines across a graph. If any vertical line crosses the graph more than once, the graph does not represent a function.
This test is especially useful when working with relations, functions, coordinate graphs, and algebraic equations.
What Is the Vertical Line Test?
The vertical line test is a graphical method used to determine whether a graph represents a function.
A relation is a function when each input value has exactly one output value. On a coordinate plane, the input is normally represented by the x-coordinate, while the output is represented by the y-coordinate.
A vertical line has the form:
x = a
That means every point on the line has the same x-coordinate.
So, when you place a vertical line over a graph, you’re essentially asking:
For this particular x-value, is there only one corresponding y-value?
If the answer is yes for every possible x-value, the graph represents a function.
How Does the Vertical Line Test Work?
Using the vertical line test is simple.
Step 1: Look at the Graph
Start with the entire graph rather than focusing on one particular point.
You want to see how the graph behaves across all possible x-values.
Step 2: Imagine a Vertical Line
Imagine drawing a straight vertical line from the top of the coordinate plane to the bottom.
You can think of sliding this line from left to right across the graph.
Step 3: Count the Intersections
Watch how many times the vertical line intersects the graph.
There are two basic possibilities:
- One intersection: This passes the test for that x-value.
- Two or more intersections: This fails the test.
Step 4: Check the Entire Graph
One successful vertical line isn’t enough.
The graph represents a function only if every possible vertical line intersects it at most once.
Why Does the Vertical Line Test Work?
The test works because of the definition of a function.
A function cannot assign two different outputs to the same input.
For example, suppose a graph contains these points:
- (2, 4)
- (2, 7)
Both points have an x-value of 2, but they have different y-values.
That means the input 2 is associated with two outputs: 4 and 7.
Therefore, the relation is not a function.
On a graph, a vertical line at x = 2 would pass through both points. That’s exactly what the vertical line test is designed to identify.
Vertical Line Test Examples
Let’s look at some familiar types of graphs.
Example 1: A Straight Line
Consider the equation:
y = 2x + 1
Its graph is a straight line that slopes upward.
A vertical line would intersect it exactly once, regardless of where you place it.
Result: It passes the vertical line test.
Therefore, the graph represents a function.
Example 2: A Parabola Opening Upward
Consider:
y = x²
The graph is a U-shaped parabola.
Although a horizontal line may intersect the parabola twice, a vertical line intersects it only once.
For example, when x = 2:
y = 2² = 4
There is only one y-value.
Result: It passes the vertical line test.
The parabola therefore represents a function of x.
Example 3: A Circle
Consider a circle centered at the origin.
A vertical line through the middle of the circle will intersect it at two points.
For example, the vertical line x = 0 crosses the circle at its top and bottom.
Result: It fails the vertical line test.
Therefore, a complete circle does not represent y as a function of x.
What Does It Mean When a Graph Fails?
When a graph fails the vertical line test, it doesn’t mean the graph is incorrect.
It simply means that the relation shown by the graph is not a function of x.
For example, a circle is a perfectly valid mathematical relation. It just doesn’t assign exactly one y-value to every x-value.
This distinction is important.
A relation can exist without being a function.
Vertical Line Test vs. Horizontal Line Test
These two tests sound similar, but they answer different questions.
Vertical Line Test
The vertical line test determines whether a graph is a function of x.
It asks:
Does each x-value have exactly one y-value?
Horizontal Line Test
The horizontal line test is generally used to determine whether a function is one-to-one.
It asks whether different x-values produce different y-values.
A horizontal line should intersect the graph no more than once for a function to be one-to-one.
Quick Comparison
| Test | Line Direction | Main Purpose |
|---|---|---|
| Vertical line test | Vertical | Determines whether a graph is a function |
| Horizontal line test | Horizontal | Determines whether a function is one-to-one |
So, if you’re simply trying to determine whether a graph represents a function, the vertical line test is the one you want.
How to Use the Vertical Line Test on Different Graphs
The method works with many types of graphs.
Linear Graphs
Most nonvertical straight lines pass the test because each x-value corresponds to only one y-value.
A vertical line itself is an important exception. A vertical line has one x-value but infinitely many y-values, so it fails the vertical line test.
Quadratic Graphs
Standard parabolas such as:
y = x²
pass the vertical line test.
Each x-value produces exactly one y-value.
Absolute Value Graphs
Graphs such as:
y = |x|
also pass because each x-value produces a single output.
Circles and Ellipses
A complete circle or ellipse generally fails because some vertical lines intersect the graph twice.
Sideways Parabolas
A sideways parabola, such as:
x = y²
also fails the vertical line test when considered as a graph of y as a function of x.
For some x-values, there are two possible y-values.
A Simple Way to Remember the Test
Here’s an easy memory trick:
Vertical = Function
When you’re checking whether a graph is a function, imagine a vertical line.
If that line ever hits the graph twice, it’s not a function of x.
Another way to remember it is:
One x, one y.
Every x-value should point to only one y-value.
Common Mistakes With the Vertical Line Test
Mistake 1: Checking Only One Vertical Line
A graph can pass one vertical line and fail another.
You need to consider the entire graph.
Mistake 2: Thinking Two Intersections Are Always Bad
Two intersections with a horizontal line don’t necessarily mean the graph isn’t a function.
The vertical line test specifically concerns vertical lines.
For example, a standard parabola passes the vertical line test even though some horizontal lines intersect it twice.
Mistake 3: Confusing Relations With Functions
A graph that fails the vertical line test isn’t necessarily meaningless.
It is still a relation. It simply isn’t a function of x.
Mistake 4: Ignoring the Definition of a Function
The test is not just a visual trick.
It works because a function assigns exactly one output to each input.
Understanding that definition makes the test much easier to remember.
Why Is the Vertical Line Test Important?
The vertical line test is useful because it allows students to identify functions without solving an equation.
Instead of analyzing complicated algebra, you can often look at the graph and make a quick determination.
It is particularly useful when:
- Interpreting graphs
- Identifying functions
- Studying relations
- Learning domain and range
- Working with inverse functions
- Analyzing algebraic models
- Checking graphical representations
It is one of the simplest connections between the visual and algebraic definitions of a function.
Read also <<< How Should You Approach a Dock When Wind or Current Is Pushing You Away
Frequently Asked Questions
What is the vertical line test used for?
The vertical line test is used to determine whether a graph represents a function of x. If any vertical line intersects the graph more than once, the graph fails the tests.
How do you perform the vertical line test?
Imagine sliding a vertical line across the entire graph. If the line touches the graph at more than one point anywhere, the graph does not represent a function of x.
What does it mean if a graph passes the vertical line test?
It means every x-value corresponds to at most one y-value. Therefore, the graph represents y as a function of x.
Can a graph pass the vertical line test but not be one-to-one?
Yes. A parabola is a common example. It can pass the vertical line test while failing the horizontal line test.
Does a circle pass the test?
No. A vertical line through many parts of a circle intersects it twice, so a complete circle does not represent y as a function of x.
What is the difference between the vertical and horizontal line tests?
The vertical line test determines whether a graph represents a function. The horizontal line test is commonly used to determine whether a function is one-to-one.
Does a vertical line itself pass the line test?
No. A vertical line has the same x-value at every point but many different y-values, so it fails the test.
Conclusion
To explain what the vertical line test is and how it is used, think of it as a quick graphical check for functions. Imagine moving a vertical line across a graph. If it intersects the graph more than once at any point, the graph is not a function of x.
The reason is simple: a function can assign only one output to each input. The test turns that definition into something you can see immediately on a graph.
Once you remember “vertical line = function check,” the test becomes much easier to use. Practice it with lines, parabolas, circles, and other graphs, and you’ll quickly recognize which relations represent functions.